Pages
SR_DPI_DNE_Direc_Corr_Box25_Folder3_001
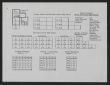
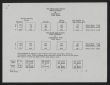
NEGRO SCHOOL ORGANIZATION ELEMENTARY, 6 YEARS - JUNIOR HIGH SCHOOL, 3 YEARS SENIOR HIGH SCHOOL, 3 YEARS - COLLEGE, 2 YEARS (See Chart)
The ELEMENTARY pupils are consolidated into 3 units. Each square on the chart represents a classroom. The classes are selected on the basis of capacity to learn. "X" classes are college possibilities--"Y" average or below--"Z" and special (Sp) have courses planned to fit their needs. The objective is to provide a maximum of educational opportunity to all pupils, regardless of ability.
The JUNIOR HIGH SCHOOL has 33 home rooms (1954-55.) The 9 section, "X" group, of highest mentality are set up for college entrance level work. The "Y" and "Z" groups have a somewhat modified course of study. The special (Sp) sections are composed of pupils who are given reading, writing, simple arithmetic, industrial arts, vocational and special cultural subjects. In this transition period, a major emphasis is placed on guidance. A place for every type of pupil is provided in the Junior High SChool. As a result, few drop out as compared to past records.
A study of the mental and achievement levels of 6th grade pupils while entering the Junior High School this year as compared to white schools, reveals problems in integration of a most sreious natore. A thorough survey and research in this field should be made before attempting to form a policy for the future.
The SENIOR HIGH SCHOOL has an exceptionally rich program in vocations. These courses have been offered for many years and have proved highly successful. Thousands of former students are now on permanent jobs because of school experiences. This includes a large umnber who rate ni the lowest 5% percentile on standard tests. Pupils of all levels of aptitude and ability have vocational, regular, and special courses adapted to their needs and intelligence. The negro high school holds pupils in school at about the same ratio as the white school. The number of boys equals the number of girls. All through the 12 grades an attempt is being made to hold in school all the former "drop outs." The standard of scholarship is maintained by sectioning according to ability. On the other hand, the lower 60%, usually eliminated in other areas, are given an opportunity to grow at their own rate of progress until they are old enough to start working for a living. The elimination of this 60% of pupils from high schools would produce a delinquency and welfare problem beyond anything the south has ever known. The 'teen age boy and girl, regardless of intelligence, must be kepts busy--take your choice--in school, or in crime.
The COLLEGE is a branch of a state college and has had recognized credit for 9 years. For schedulign teachers' classes on college level, and in order to provide teachers prepared in special fields, the 11th and 12th year top mental level pupils also are taught by the same teachers as college students. This 4 year college unit has proved satisfactory and very interesting. These consolidated schools have produced a wholesome and progressive atmosphere and influenced every phase of life in the community. The young people show pride in their race and in the success of their own efforts. The result is loyal and productive American citizens. The southern white citizen is proud of the rapid development of his negro neighbor. The North Carolina plan of racial adjustment has proved superior to any yet presented in any part of the world.
SR_DPI_DNE_Direc_Corr_Box25_Folder3_002
This page is not transcribed, please help transcribe this page
SR_DPI_DNE_Direc_Corr_Box25_Folder3_003
This page is not transcribed, please help transcribe this page
SR_DPI_DNE_Direc_Corr_Box25_Folder3_004
This page is not transcribed, please help transcribe this page
SR_DPI_DNE_Direc_Corr_Box25_Folder3_005
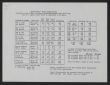
THE JUNIOR HIGH SCHOOLS Pupil Placment by Achievement (1954 Test)
College Ability Group below Not Capable of Superior Average Average High School Work
W 285 553 713 436 N 3 32 166 429
T 288 585 865 865